AI-Powered Chart Analysis
Get instant predictions for market direction by uploading your chart image. Our AI analyzes visual patterns and provides accurate trend predictions.
📋 Step by Step Guide
Login or Create Account
Start by logging in to your account or create a new one to access analysis services. Free users get 10 daily analyses.
💡 Important Tips:
- Registration is free and fast
- Keep your login details secure
- Verify your email for updates
Login Page
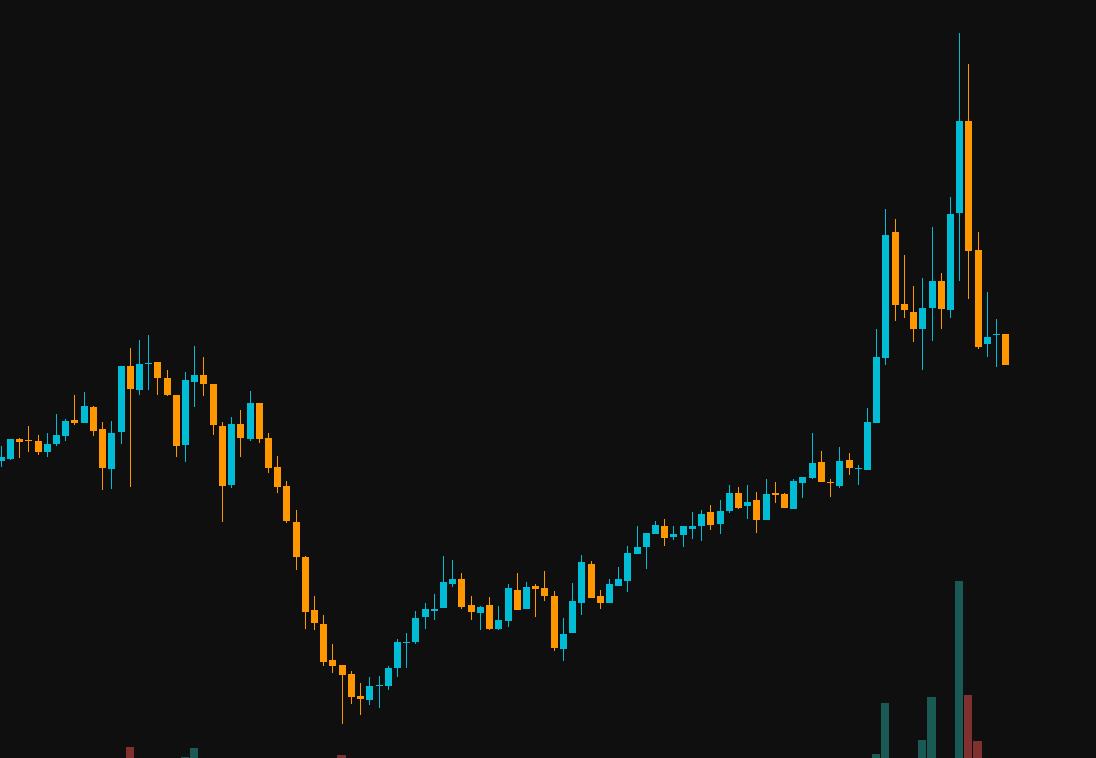
Upload Your Chart
Choose a clear chart image from your device or capture directly using your camera.
📸 For Best Results:
- Use clear, high-quality images
- Make sure the chart is fully visible
- All timeframes are supported
- Avoid cropped or blurry images
Wait for Analysis
The AI analyzes your image and identifies visual patterns. This process usually takes just a few seconds.
⏱️ While Waiting:
- Don't close the page during analysis
- Usually less than 10 seconds
- A loading screen will appear
Analyzing...
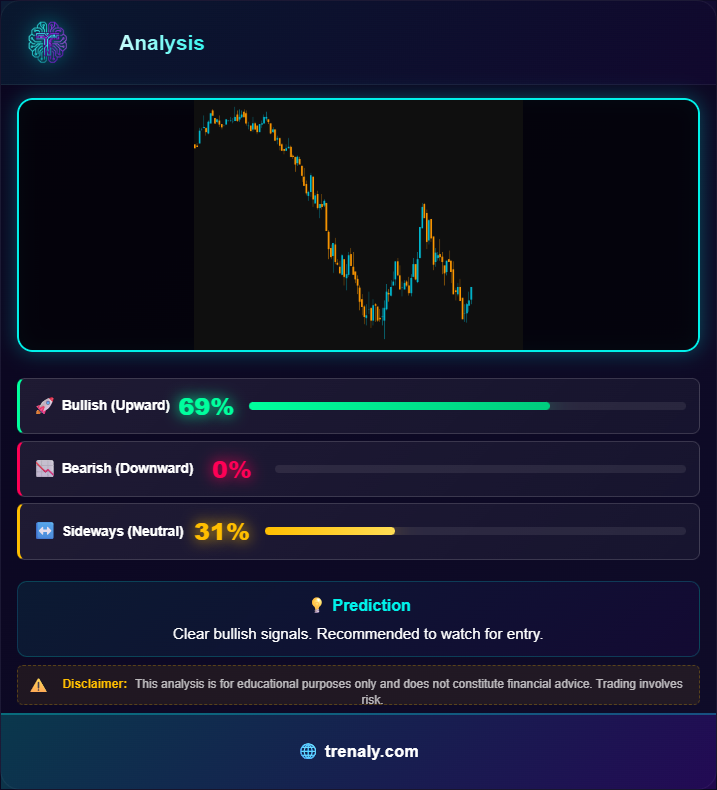
View Results & Recommendations
Get detailed results including trend percentages (Bullish, Bearish, Sideways) with smart recommendations and sharing options.
📊 Understanding Results:
- Green = Bullish trend
- Red = Bearish trend
- Orange = Sideways trend
🔔 Smart Alerts Feature

Smart Alerts - Automated Monitoring
Set up automated alerts that continuously monitor the market and notify you when AI analysis matches your specified conditions. Never miss a trading opportunity!
Create Your Alert
Go to the Alerts page and click "New Alert". Choose the asset you want to monitor from our extensive list of cryptocurrencies, forex pairs, metals, and indices.
💡 Important Tips:
- Set higher confidence for more reliable signals
- Alert history is saved for 90 days

Set Your Conditions
Configure your alert settings: select the timeframe (1H, 4H, 1D), scan frequency (every 1, 4, or 12 hours), required trend direction (Bullish, Bearish, or Sideways), and minimum confidence level.
⚙️ Understanding Results:
- Timeframe: 1H, 4H, 1D
- Scan Every: 1, 4, 12 hours
- Required Direction: Bullish, Bearish, Sideways

Receive Notifications
When the AI analysis matches your conditions, you will receive an instant notification. View the analysis details, trend percentages, and recommendations directly from the alert.
📱 Important Tips:
- Use longer scan intervals to avoid frequent notifications
- You can pause or silence alerts temporarily

📈 AI Pair Analysis Feature
AI Pair Analysis - Real-Time Chart Generation
Select any trading pair and let our AI generate a real-time chart and analyze it instantly. No need to upload images - just pick your pair and get instant AI-powered analysis with trend predictions and recommendations.
Select Your Trading Pair
Choose a category (Crypto, Forex, Metals, or Indices), then select the trading pair you want to analyze from the available list.
💡 Important Tips:
- Browse categories to find your desired pair
- Popular pairs like BTC/USDT, EUR/USD are available
- Use the search to quickly find specific pairs
Select Trading Pair
Choose Timeframe & Analyze
Select your preferred timeframe (1H, 4H, 1D, 1W) and press the Analyze button. The AI will generate a real-time chart and analyze it instantly.
⏱️ Available Timeframes:
- 1H - Hourly: Best for short-term trading
- 4H - 4 Hours: Good for swing trading
- 1D - Daily: Suitable for position trading
- 1W - Weekly: For long-term trend analysis
Available Timeframes
View Chart & AI Results
The AI generates a professional chart and analyzes it instantly. You will see the generated chart image along with trend percentages (Bullish, Bearish, Sideways) and a smart recommendation.
📊 Understanding Results:
- The generated chart shows real market data
- Trend percentages show the AI confidence level
- You can download or share the results
- Try different timeframes for a complete picture
Chart & Results
🎨 Understanding Colors & Trends
Bullish (Upward)
Market shows upward momentum. Good opportunity for buying.
Bearish (Downward)
Market shows downward pressure. Be cautious with new entries.
Sideways (Neutral)
Market is consolidating. Better to wait for clearer signals.
❓ Frequently Asked Questions
Free users get 10 analyses per day. Subscribers get a large number of daily analyses.
Free users get 1 alert. Subscribers get 5 alerts.
All chart types are supported: candlestick, line, bar charts. Works with any timeframe.
Our AI model is trained on thousands of chart patterns. However, remember that no prediction is 100% accurate and this is for educational purposes only.
Yes, your analyses are saved for 90 days. You can view them anytime from the history page.
Image upload allows you to analyze any chart screenshot. Pair analysis generates a real-time chart for the selected trading pair and timeframe, then analyzes it using AI. Both methods provide the same AI-powered trend predictions.
Ready to Start?
Try our AI analysis tool now and get instant predictions for your charts