تحليل الشارتات بالذكاء الاصطناعي
احصل على توقعات فورية لاتجاه السوق من خلال رفع صورة الشارت. يقوم الذكاء الاصطناعي بتحليل الأنماط البصرية وتقديم توقعات دقيقة.
📋 دليل خطوة بخطوة
تسجيل الدخول أو إنشاء حساب
ابدأ بتسجيل الدخول إلى حسابك أو قم بإنشاء حساب جديد للاستفادة من خدمات التحليل. المستخدمون المجانيون يحصلون على تحليل واحد يومياً.
💡 نصائح مهمة:
- التسجيل مجاني وسريع
- احفظ بيانات دخولك بأمان
- فعّل بريدك الإلكتروني للتحديثات
صفحة تسجيل الدخول
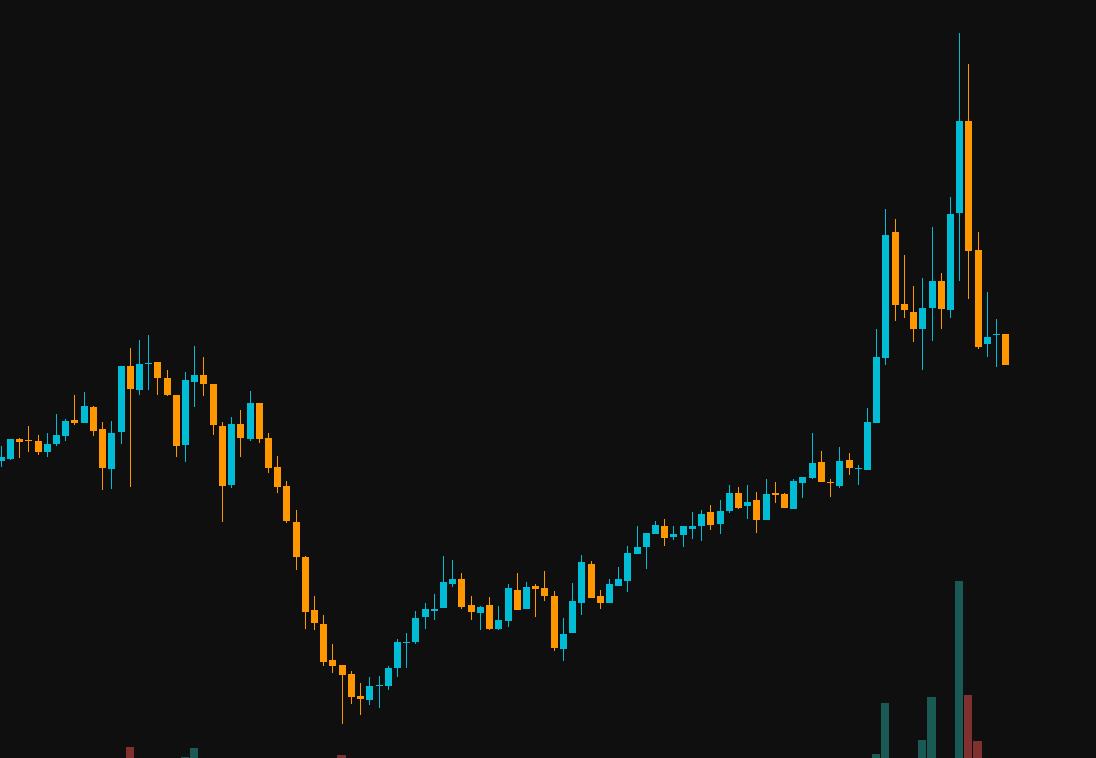
رفع صورة الشارت
اختر صورة واضحة للشارت من جهازك أو التقط صورة مباشرة باستخدام الكاميرا.
📸 للحصول على أفضل نتائج:
- استخدم صور واضحة وعالية الجودة
- تأكد من ظهور الشارت بالكامل
- جميع الفواصل الزمنية مدعومة
- تجنب الصور المقطوعة أو المشوشة
انتظار التحليل
يقوم الذكاء الاصطناعي بتحليل الصورة والتعرف على الأنماط البصرية. تستغرق العملية عادة بضع ثوانٍ فقط.
⏱️ أثناء الانتظار:
- لا تغلق الصفحة أثناء التحليل
- عادة أقل من 10 ثوانٍ
- ستظهر شاشة تحميل
Analyzing...
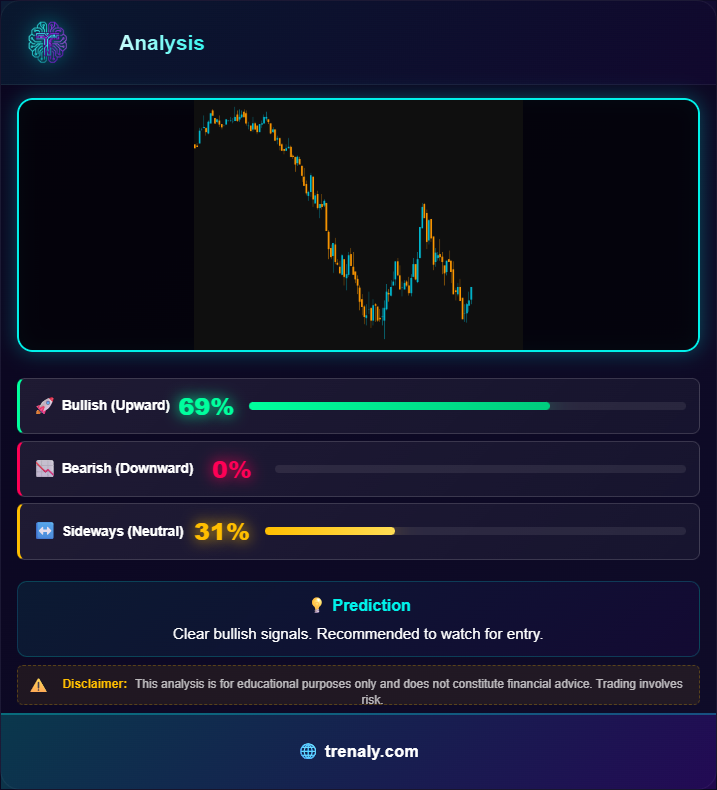
عرض النتائج والتوصيات
احصل على نتائج مفصلة تشمل نسب الاتجاهات (صعودي، هبوطي، عرضي) مع توصية ذكية وإمكانية المشاركة.
📊 فهم النتائج:
- الأخضر = اتجاه صعودي
- الأحمر = اتجاه هبوطي
- البرتقالي = اتجاه عرضي
🔔 ميزة التنبيهات الذكية
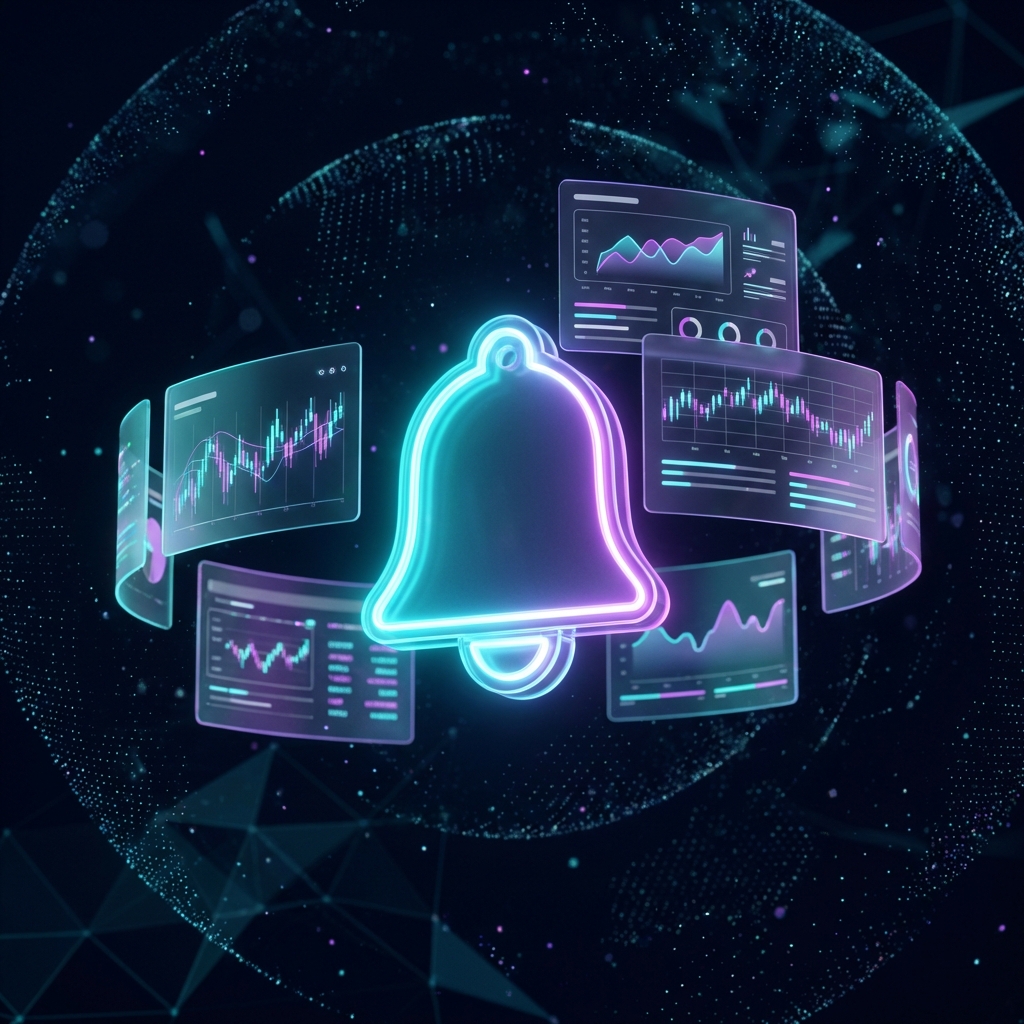
التنبيهات الذكية - مراقبة آلية للسوق
أنشئ تنبيهات آلية تراقب السوق باستمرار وتُرسل لك إشعاراً فورياً عندما يتطابق تحليل الذكاء الاصطناعي مع الشروط التي تحددها. لا تفوّت أي فرصة تداول!
إنشاء التنبيه
انتقل إلى صفحة التنبيهات واضغط على "تنبيه جديد". اختر الأصل الذي تريد مراقبته من قائمتنا الشاملة للعملات الرقمية وأزواج الفوركس والمعادن والمؤشرات.
💡 نصائح مهمة:
- اضبط ثقة أعلى للحصول على إشارات أكثر موثوقية
- يتم حفظ سجل التنبيهات لمدة 90 يوماً

ضبط الشروط
اضبط إعدادات التنبيه: اختر الفاصل الزمني (1 ساعة، 4 ساعات، يوم)، تكرار الفحص (كل 1 أو 4 أو 12 ساعة)، الاتجاه المطلوب (صعودي أو هبوطي أو عرضي)، والحد الأدنى للثقة.
⚙️ فهم النتائج:
- الفاصل الزمني: 1H, 4H, 1D
- فحص كل: 1, 4, 12 ساعة
- الاتجاه المطلوب: صعودي, هبوطي, عرضي

استقبال الإشعارات
عندما يتطابق تحليل الذكاء الاصطناعي مع شروطك، ستتلقى إشعاراً فورياً. اطلع على تفاصيل التحليل ونسب الاتجاهات والتوصيات مباشرة من التنبيه.
📱 نصائح مهمة:
- استخدم فترات فحص أطول لتجنب الإشعارات المتكررة
- يمكنك إيقاف أو صمت التنبيهات مؤقتاً

📈 ميزة تحليل الأزواج بالذكاء الاصطناعي
تحليل الأزواج - شارت حقيقي بالوقت الفعلي
اختر أي زوج تداول ودع الذكاء الاصطناعي يقوم بتوليد شارت حقيقي بالوقت الفعلي وتحليله. لا حاجة لرفع صور - فقط اختر الزوج واحصل على تحليل فوري مدعوم بالذكاء الاصطناعي مع توقعات الاتجاه والتوصيات.
اختر زوج التداول
اختر الفئة (عملات رقمية، فوركس، معادن، أو مؤشرات)، ثم اختر زوج التداول الذي تريد تحليله من القائمة المتاحة.
💡 نصائح مهمة:
- تصفح الفئات للعثور على الزوج المطلوب
- أزواج شهيرة مثل BTC/USDT و EUR/USD متاحة
- استخدم البحث للعثور على أزواج محددة بسرعة
اختيار زوج التداول
اختر الفاصل الزمني وابدأ التحليل
اختر الفاصل الزمني المفضل (1 ساعة، 4 ساعات، يومي، أسبوعي) واضغط زر التحليل. سيقوم الذكاء الاصطناعي بتوليد شارت حقيقي بالوقت الفعلي وتحليله.
⏱️ الفواصل الزمنية المتاحة:
- 1H - ساعة: الأفضل للتداول قصير المدى
- 4H - 4 ساعات: مناسب للتداول المتأرجح
- 1D - يومي: مناسب لتداول المراكز
- 1W - أسبوعي: لتحليل الاتجاه طويل المدى
الفواصل الزمنية المتاحة
عرض الشارت ونتائج الذكاء الاصطناعي
يقوم الذكاء الاصطناعي بتوليد شارت احترافي وتحليله فوراً. سترى صورة الشارت المولّد مع نسب الاتجاهات (صعودي، هبوطي، عرضي) وتوصية ذكية.
📊 فهم النتائج:
- الشارت المولّد يعرض بيانات السوق الحقيقية
- نسب الاتجاه تعكس مستوى ثقة الذكاء الاصطناعي
- يمكنك تحميل أو مشاركة النتائج
- جرب فواصل زمنية مختلفة للحصول على صورة شاملة
الشارت والنتائج
🎨 فهم الألوان والاتجاهات
صعودي (Bullish)
السوق يظهر زخماً صعودياً. فرصة جيدة للشراء.
هبوطي (Bearish)
السوق يظهر ضغطاً هبوطياً. كن حذراً مع الدخول الجديد.
عرضي (Sideways)
السوق في حالة تماسك. الأفضل انتظار إشارات أوضح.
❓ الأسئلة الشائعة
المستخدمون المجانيون يحصلون على 10 تحليلات يومياً. المشتركون يحصلون على عدد كبير من التحليلات يومياً.
المستخدمون المجانيون يحصلون على تنبيه واحد. المشتركون يحصلون على 5 تنبيهات.
جميع أنواع الشارتات مدعومة: الشموع اليابانية، الخطية، الأعمدة. يعمل مع أي فاصل زمني.
نموذج الذكاء الاصطناعي مدرب على آلاف الأنماط. لكن تذكر أن لا توقع دقيق 100% وهذا للأغراض التعليمية فقط.
نعم، تُحفظ تحليلاتك لمدة 90 يوماً. يمكنك عرضها في أي وقت من صفحة السجل.
رفع الصور يتيح لك تحليل أي لقطة شارت. تحليل الأزواج يقوم بتوليد شارت حقيقي بالوقت الفعلي لزوج التداول والفاصل الزمني المحددين، ثم يحلله بالذكاء الاصطناعي. كلا الطريقتين توفران نفس التوقعات المدعومة بالذكاء الاصطناعي.
هل أنت مستعد للبدء؟
جرب أداة تحليل الذكاء الاصطناعي الآن واحصل على توقعات فورية لشارتاتك